Excel has forever been one of the vital software programs for managing businesses. However, there has been a lot of change in this software program since the inception of its journey. Here, you will learn how to calculate variance in Excel.
There are multiple types of variances. If you are a business person, consider the vitality of knowing about variance to help you reach essential insights regarding your business. Before going through the procedures of calculating the variance, you can check out the definition of variance.
For now, go through the sections given below:
Variance: Definition
Before you learn how to calculate sample variance in Excel, consider it necessary to know the definition. In simple words, variance is the measurement of data variability. Mathematically, it is the average value of squared differences concerning the mean. It is a mathematical process that comes under the statistics and analytics part.
Generally, business owners and experts make data sets and find variances to predict market security and volatility. Moreover, you can also apply the process for how to calculate variance percentage in Excel. So, you must learn it properly and clear all your concepts.
A Case Study

This case study is about the application of variance. It is a simple one that you can understand easily but expect to deal with more complicated processes in reality. Have a look:
Suppose there are four dogs in your locality, and you need to get the variance value of their age. In this case, you need to find out the mean value of their ages at first.
So, if the four dogs in your locality are 2, 8, 10, and 14 years of age, the mean for their age will be:
Mean = (2+8+10+14) /4= 8.5
To find the variance, you have to differentiate the mean from each number. Then, once you get the results, find the squared differences and work out its average for its variance.
The process for calculating the variance in Excel is just the same, but you would need to give the commands on Excel rightly.
Variance: Importance
Variance is essential in the case of business data handling as it gives a general idea of data dispersion. If the data is more spread out for a business, experts can learn about its positive and negative effects.
Calculating Variance In Excel
If you have read the article here, it is obvious that you have gone through the case study and facts already. So, now it is time for the main thing, which is how to calculate variance in Excel. There are two processes for it, and the steps for both are as follows:
1. Sample Variance Calculation On Excel
The sample is the word for the data set you to extract from a specific population. Now, the variance of this data set is simply known as Sample Variance. You can go through the following steps to understand how to find sample variance:
The formula of Sample Variance is:
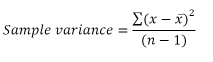
Here, n denotes the sample size (amount of values in a sample), while x is the mean of the sample values. You can use one of the three functions while finding the sample variance like VAR.S, VAR, and VARA.
The Procedure Of Manual VAR Calculation
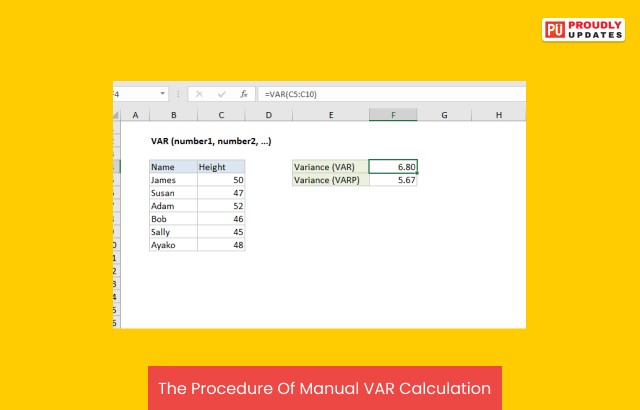
Step 1: Use the ‘AVERAGE’ function to find the mean of the given data by the command =AVERAGE (B2:B7)
Step 2: Check if the average comes on the next empty cell B8.
Step 3: Differentiate the average from all the data present in the sample with the command =B2-$B$8.
Step 4: Check if the differences go to column C.
Step 5: Find square roots of each number present in column C with the formula C2^2
Step 6: Add the squared differences and calculate the average again with the formula =SUM (D2: D7) / (6-1)
The final result you see after the entire procedure is the sample variance. However, there are certain things you need to keep in mind while being concerned about how to find variance in Excel. They are:
Use the VARA procedure only if there are no Boolean or Text values in the data
Remember to use the VAR and VAR.S procedures in case you have alpha-numeric values
2. Population Variance Calculation In Excel
This part deals with how to calculate population variance in Excel. It is essential to indicate the total spread out of the data points in the entire population.
The formula of Population Variance is:
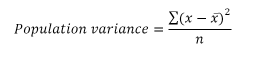
Here, n denotes the population size or the amount of values. Similarly, x is the mean. Moreover, quite similar to the Sample Variance, there are three functions for the Population Variance: VARP, VAR.P, and VARPA.
The manual procedure to check the Population Variance on Excel remains the same as mentioned above. Only you need to take care of the functions while entering them.
Standard Deviation On Excel: Need
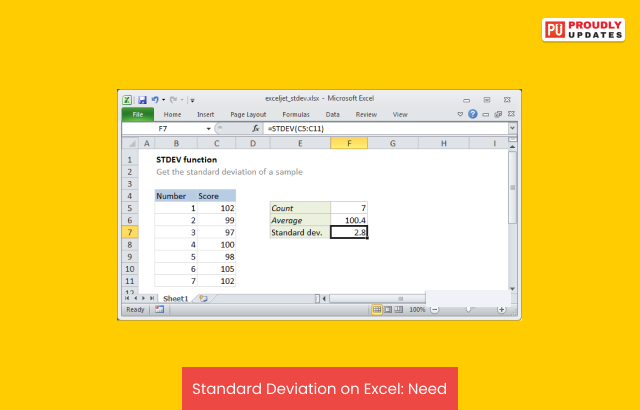
Although not directly linked, Standard Deviation can be an extension to Variance on Excel. Often, the data experts use it to get practical information from the data set. So, if you are concerned about how to calculate variance and standard deviation in Excel, go through the following points:
Formulas: The standard deviation formulas are STDEVA, STDEV, and STDEV.S. You can use these to measure the sample standard deviation. For population standard deviation, the formulas are STDEV. P, STDEVP, and STDEVPA.
Manual Procedure: The manual procedure is the same as measuring the Sample Variance. The only thing you need to do is put the formulas in the right place.
Frequently Asked Questions
Q1. How To Find The Variance On Excel?
You can find the variance on Excel if your data is in the single range of cells. Moreover, you need to check if the data denotes a total population. If the entire procedure goes right, you can expect the correct variance value to appear on the screen. This is a vital thing to remember when it comes to how to calculate the variance in Excel.
Q2. What Is Variance Function In Excel?
The Variance function in Excel is VAR. Therefore, you can use it in multiple procedures even if you are concerned about how to calculate pooled variance in Excel.
Q3. What Is The Difference Between Varp And Vars In Excel?
The only difference between VARS and VARP on Excel is simple. Where the prior one considers the data as a sample, the latter considers it as a population.
Q4. How Do I Find The Coefficient Of Variation On Excel?
You can find the coefficient of variation on Excel by taking support of the formulas of mean and standard deviation. If you are thinking about how to calculate the variance of stock returns in Excel, you can use the formulas too.
Final Words
Calculating Variance in Excel is an advanced process done mostly by data experts. Nevertheless, you can follow all the procedures and formulas given in the article to churn the necessary insight from the data. Furthermore, if you are still anxious about how to calculate variance in Excel, make sure the data is in perfect condition on the Excel sheet.
Always try to know about the type of a function as you input it on the page. The best you can do is study all the functions in detail before you use them. Proper knowledge can ensure that you use every function in the right way.
Read also: